
Two national averages at opposite extremes
The same calculation is applied to both profiles: latest imported population divided by EqualAtlas mapped area.
 Mongolia
- Mapped area
- 1,560,431 km²
- Population (2025)
- 3,568,978
- Calculated density
- 2.3 people/km²
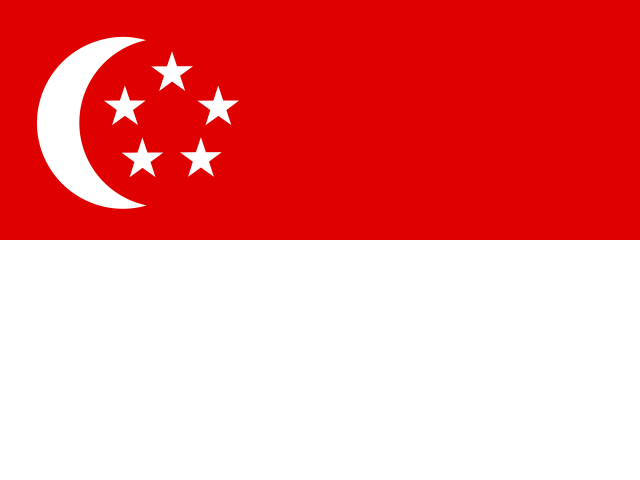 Singapore
- Mapped area
- 484 km²
- Population (2025)
- 6,111,175
- Calculated density
- 12,626.4 people/km²
The contrast is real at country scale, but neither value describes the density experienced at every location inside the boundary.
The short answer
Population density is a ratio for a chosen boundary. Crowding is a lived condition that depends on how people are distributed within that boundary, how much usable space exists and what scale of place is being discussed.
Mongolia averages approximately 2.3 people per km² in this dataset, while Singapore averages about 12,626.4. The numbers describe whole-country denominators; they do not say that every Mongolian settlement is empty or every part of Singapore feels equally crowded.
The national average hides spatial distribution
Imagine placing every resident evenly across a country's mapped area. That imaginary redistribution is what a simple national density ratio resembles. Real populations cluster around water, jobs, transport and suitable land.
A country can therefore have a low average and a dense capital, or a high average and still contain parks, reservoirs and lower-density districts. The finer the question, the finer the geographic data must become.
The denominator changes the story
Total area, land area, habitable land and urban built-up area are different denominators. Dividing the same population by each one produces a different density, and none is automatically the right choice for every question.
EqualAtlas uses its displayed mapped area so the map and calculation remain internally consistent. It labels that choice rather than presenting density as definition-free.
What the true-scale overlay teaches
At one equal-area scale, Singapore is nearly invisible beside Mongolia. Enlarging Singapore in an inset would help visibility but would require an explicit scale warning. The honest global view and the useful local view serve different purposes.
How to read a density map responsibly
Check the population year, boundary type and area denominator. Use the national layer to identify broad contrasts, then consult gridded population or subnational statistics before making claims about settlement patterns, housing pressure or lived crowding.
Explore the evidence
Sources and further reading
Continue with the Equal Earth projection guide, try the interactive map, or review our methodology.