Ten tiny sovereign profiles in the atlas
These selected sovereign and Holy See/Vatican profiles are ordered by the area of their displayed Natural Earth geometry.
- #1
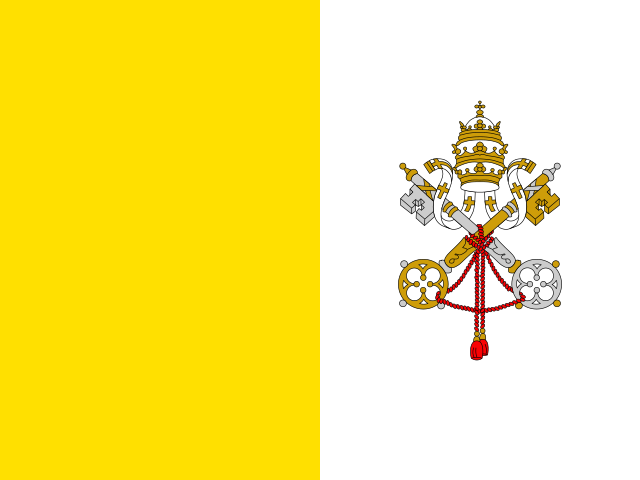 Vatican City1 km²Generalized mapped footprint—not official surveyed area
 - #2
 Monaco12 km²Generalized mapped footprint—not official surveyed area
 - #3
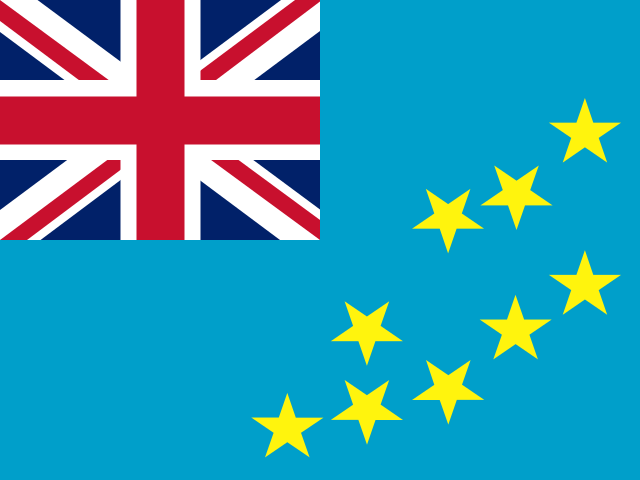 Tuvalu24 km²Generalized mapped footprint—not official surveyed area
 - #4
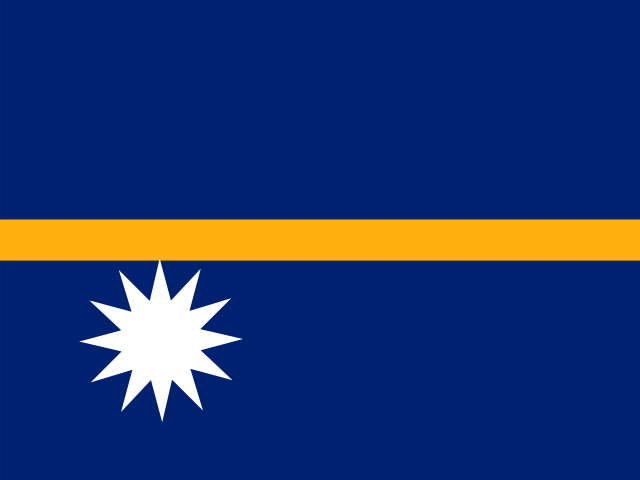 Nauru28 km²Generalized mapped footprint—not official surveyed area
 - #5
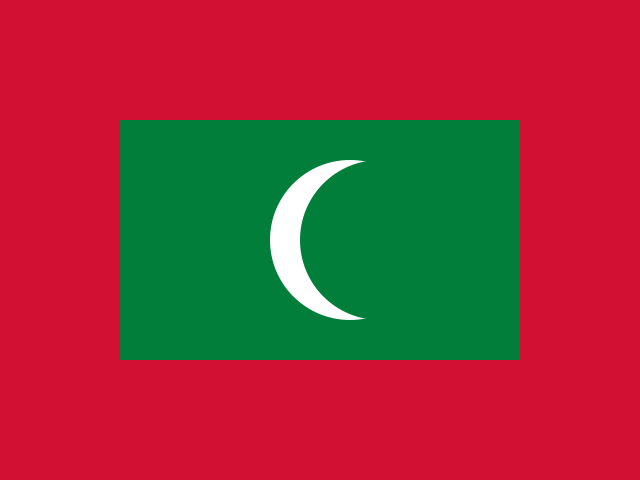 Maldives67 km²Generalized mapped footprint—not official surveyed area
 - #6
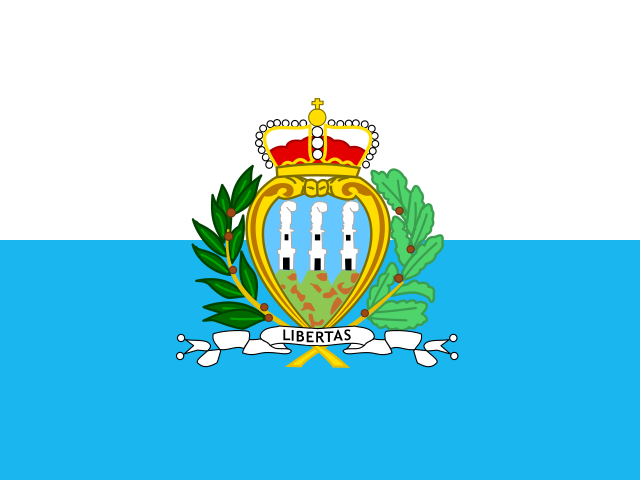 San Marino70 km²Generalized mapped footprint—not official surveyed area
 - #7
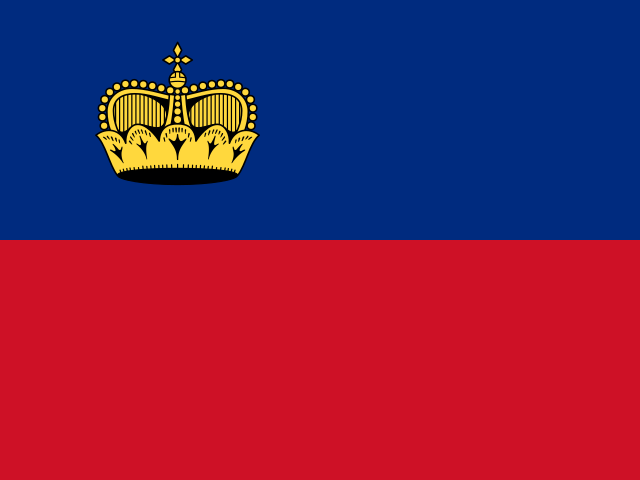 Liechtenstein138 km²Generalized mapped footprint—not official surveyed area
 - #8
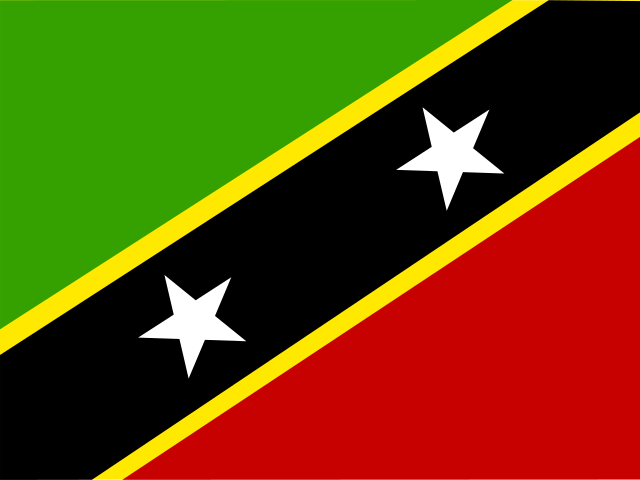 Saint Kitts and Nevis234 km²Generalized mapped footprint—not official surveyed area
 - #9
 Marshall Islands236 km²Generalized mapped footprint—not official surveyed area
 - #10
 Malta276 km²Generalized mapped footprint—not official surveyed area
At this scale, coastline and boundary generalization can be large relative to the place itself. The figures are useful for reproducing the displayed atlas geometry, not for ranking tiny states by survey-grade official area.
Five honest visibility techniques
A tiny place can be discoverable without changing the area encoded by its polygon.
| Technique | What it does | Area meaning |
|---|---|---|
| True-scale polygon | Draws the available boundary | Preserved, but may be sub-pixel |
| Selection point | Creates a clickable target | Point is a locator, not area |
| Halo or leader line | Makes position visible | Decoration carries no area value |
| Labelled inset | Shows local shape larger | Uses a declared independent scale |
| Profile silhouette | Fits one outline to its panel | For shape study, not direct area comparison |
EqualAtlas comparisons use a shared equal-area scale. Independently fitted profile silhouettes are explicitly separated from that comparison function.
The short answer
Do not silently enlarge a microstate polygon on an area map. Keep the geography at the map's stated scale, then add a clearly different interaction or annotation layer so the place can still be found.
A visible point can say ‘the state is here’; it must not imply ‘the state covers this much area.’ Separating those two visual roles is the foundation of honest microstate cartography.
Why tiny polygons disappear
A global map compresses the whole Earth into a limited number of pixels. Some sovereign states are smaller than the ground area represented by one screen pixel, so even perfectly accurate geometry cannot become visibly large without changing scale.
Higher-resolution boundaries add detail but do not solve the fundamental display limit. Zoom, insets and labelled points solve discoverability while keeping the area encoding explicit.
Why the smallest area values need caution
EqualAtlas derives mapped area from generalized Natural Earth polygons. When a country is very small, a minor shift in a simplified coastline or boundary can become a large percentage of its total.
That is why the ranking labels every number as a mapped footprint and why a profile links to methodology instead of presenting the value as an official legal measurement.
Territories are not silently mixed with states
The full EqualAtlas directory includes ISO-coded countries and territories because global source datasets publish both. Editorial rankings must state whether they include territories, sovereign states or a curated teaching set.
This page uses a selected sovereign-state set plus the Holy See/Vatican profile. It does not convert every tiny territory into a sovereign-state claim merely because both have map geometry.
The design rule for future insets
Every enlarged inset should show its own scale or state plainly that it is not at the world-map scale. Selection halos and point markers should have a distinct visual language from filled thematic polygons.
This rule will also guide future downloadable classroom charts and embeddable mini-maps, where a small canvas makes silent enlargement especially tempting.
Explore the evidence
Sources and further reading
Continue with the Equal Earth projection guide, try the interactive map, or review our methodology.